
After six consecutive years of declining accident statistics, 2012 had an increase in deaths and injury accidents. There were 33,561 fatalities on our nations highways in 2012, compared to 32,479 in 2011. An increase in motorcycle and pedestrian fatality accidents was partially responsible for the increase. There were 2.36 million persons who were injured in car accidents in 2012, compared to 2.2 million in 2011.
Overview of 2012 Accident Statistics
- 3.3% increase in motor vehicle fatalities over 2011
- 72% of 2012 fatalities occurred in the first quarter (Jan-March), over 50% of these fatalities involved motorcycles and pedestrians
- injuries in accidents increased for the first time since 1995. there were 145,000 more reported injuries in 2012 than in 2011.
- 10,322 people died as a result of alcohol impaired driving, a 4.6% increase from the previous year.
- Motorcyclist were responsible for 15% of the fatalities in 2012
Occupants and nonoccupants killed or injured in 2012 car accidents
2012 Fatalities per vehicle type
- Passenger Cars-12,271 +2.1%
- Light Trucks-9396 +1.0%
- Large Trucks( Tractor Trailers)-697 +8.9%
- Motorcycles-4957 +7.1%
- Pedestrians-4743 +6.4%
- petalcyclist (bicycle)-726 +6.5%
- Other/Unknown-223
2012 Injuries per vehicle type
- Passenger Cars-2,091,000 +7.1%
- Light Trucks-762,000 +4.7%
- Large Trucks-25,000 +8.7%
- Motorcycles-93,000 +15%
- Pedestrians-76,000 +10%
- petalcyclist (bicycle)-49,000 +2.1%
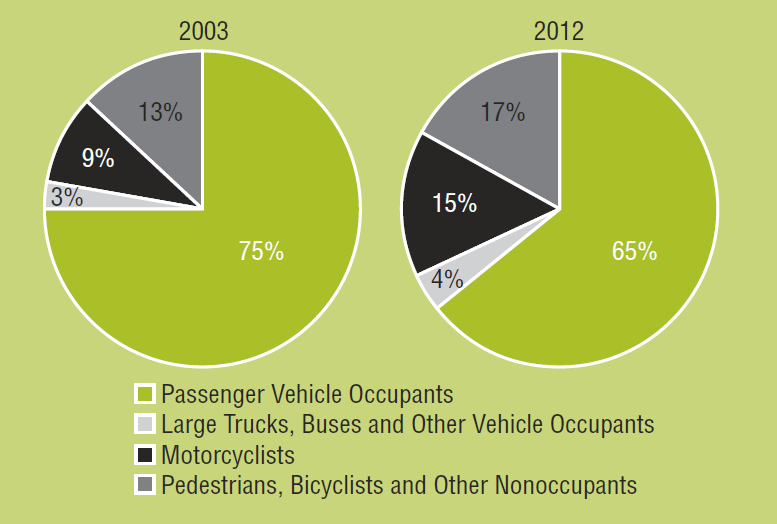
Change in Type of Fatality Accident
The proportions of fatal accidents has changed since 2003. Passenger vehicles ( -10%), Motorcyclist (+6%), Large Trucks (+1), nonoccupants (+4%).
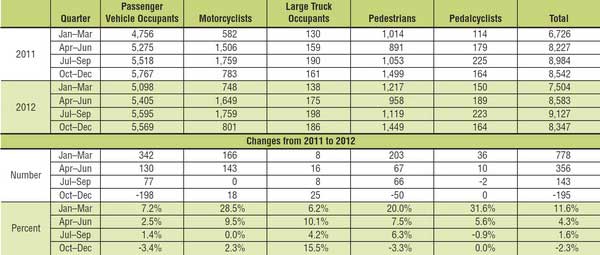
2012 quarterly Accident Fatality Data
The first quarter of 2012 saw a significant increase in fatal accidents than in previous years. There were 1,082 more fatal accidents in 2012 than in 2011. Of these , 778 occurred within the first quarter (Jan-Mar). The largest increase in the first quarter was motorcyclist and non occupant fatalities. This might sound unusual, these are winter months. According to NOOA, 20012 had the warmest first quarter since 1897. This warm weather is more than likely the cause of the increased number in motorcyclist and pedestrian fatalities.
2012 Alcohol impaired Fatality Accidents
10,322 Persons lost their lives in 2012 to Alcohol impaired driving. Alcohol impaired accidents accounted for 31% of overall fatalities in 2012. There was a 4.6% increase over the previous year (2011). Alcohol impaired fatality is defined as a fatality in a wreck involving a driver with the blood alcohol level of .08 or greater.
Alcohol impaired driving fatalities by vehicle type
- Passenger Car-4,104
- Light Truck (Van)-267
- Light Truck (Utility)-1,483
- Light Truck (Pickup)-1,946
- Motorcycles-1,390
- Large Trucks-80
Seat belt use or restraint system in 2012 fatality accidents
52% of people killed in accidents in 2012 were not wearing a seatbelt. At night, those figures go up, 61% were not wearing seatbelts. 39% during the daytime hours. We saw some statistics earlier this year that suggested seat belt use was up to 84% . It’s clear there are higher number of fatal accidents with occupants not wearing any restraint system or seat belts.However, It’s clear looking at the statistics that seat belts save lives, but only if you wear them.
Total Fatalities by state
Alaska-59
Arizona-825
Arkansas-552
California-2857
Colorado-472
Connecticut-236
Delaware-114
D.C.-15
Florida-2424
Georgia-1192
Hawaii-126
Idaho-184
Indiana-779
Iowa-365
Kansas-405
Kentucky-746
Louisiana-722
Maine-164
Maryland-505
Massachusetts-349
Michigan-938
Minnesota-395
Mississippi-582
Missouri-826
Nebraska-212
Nevada-258
New Hampshire-108
New Jersey-589
New Mexico-365
New York-1168
North Carolina-1292
North Dakota-170
Ohio-1123
Oklahoma-708
Oregon-336
Pennsylvania-1310
Rhode Island-64
South Carolina-863
South Dakota-133
Tennessee-1014
Texas-3398
Utah-217
Vermont-77
Virginia-777
Washington-444
West Virginia-339
Wisconsin-615
Wyoming-123
Numbers by the state name are the total fatalities for that state in 2012